Data Collection, Categorization, Reliability and Validity
AHL 4.12 — Data Collection, Categorisation, Reliability and Validity
IB Mathematics: Applications and Interpretation HL
Lesson Overview
In this lesson, we study how to design valid data collection methods, choose relevant variables, categorize numerical data for chi-squared tests, determine appropriate degrees of freedom, and distinguish between reliability and validity.
You should be able to evaluate surveys and questionnaires, identify biased or imprecise questions, explain different types of reliability and validity, and justify decisions when preparing data for a chi-squared goodness-of-fit test.
Key Concepts
- Biased and unbiased questions
- Personal and impersonal questions
- Structured and unstructured questions
- Precise questioning
- Selecting relevant variables
- Categorizing numerical data
- Expected frequencies in a chi-squared test
- Degrees of freedom when estimating parameters
- Reliability and validity
- Test-retest reliability
- Parallel-forms reliability
- Content validity
- Criterion-related validity
1. Designing Valid Data Collection Methods
When we collect data, the quality of our conclusions depends strongly on how the data were collected.
A poorly designed survey can produce misleading data, even if the statistical calculations carried out afterwards are completely correct.
Common methods of collecting data include:
- surveys
- questionnaires
- interviews
- observations
- experiments
- existing databases or records
For this topic, particular attention is given to surveys and questionnaires.
2. Biased and Unbiased Questions
A question is biased if its wording encourages the respondent to give a particular answer.
A good survey question should be as neutral as possible.
Example 1
Biased question:
“Don’t you agree that the school should provide healthier lunches?”
This encourages the respondent to agree.
Improved question:
“Do you think the school should provide healthier lunches?”
Possible responses:
- Yes
- No
- Unsure
Example 2
Biased:
“How much do you enjoy our excellent new school cafeteria?”
The word excellent already suggests that the cafeteria is good.
Unbiased:
“How would you rate the new school cafeteria?”
- Very poor
- Poor
- Satisfactory
- Good
- Very good
Exam Tip
If asked why a question is biased, do not simply write “It is biased.”
Explain how the wording influences the respondent.
For example:
“The word ‘excellent’ suggests that the cafeteria is good and may encourage respondents to give a positive response.”
3. Personal and Impersonal Questions
A question may ask about the respondent personally, or it may ask about a broader issue.
Personal question:
“How many hours do you study mathematics each week?”
The respondent provides information about themselves.
Impersonal question:
“How many hours per week do you think IB students should study mathematics?”
This asks for an opinion rather than personal behaviour.
Personal questions can sometimes cause difficulties if they concern sensitive subjects such as:
- income
- examination performance
- health
- family circumstances
- illegal behaviour
Respondents may refuse to answer or may give inaccurate information.
Example
Instead of asking:
“How much money does your family earn each month?”
A survey could provide ranges:
“Which range best represents your household’s monthly income?”
This can make respondents more comfortable answering.
4. Structured and Unstructured Questions
Structured Questions
A structured question gives respondents a fixed set of possible answers.
Example:
“How often do you exercise?”
- Never
- Once per week
- 2–3 times per week
- 4–5 times per week
- More than 5 times per week
Advantages:
- easy to answer
- easy to compare
- easy to analyse statistically
- reduces ambiguity
Disadvantage:
The available choices may not completely represent the respondent’s opinion.
Unstructured Questions
An unstructured question allows respondents to answer freely.
Example:
“What changes would you like to see in the school’s mathematics programme?”
Advantages:
- allows detailed responses
- may reveal unexpected ideas
- allows respondents to explain their opinions
Disadvantages:
- harder to classify
- harder to compare
- harder to quantify
- harder to analyse statistically
5. Consistent Answer Choices
For structured questions, answer choices should be consistent, non-overlapping and complete.
Poorly designed categories:
- 0–2 hours
- 2–4 hours
- 4–6 hours
- More than 6 hours
Where should someone who exercises exactly 2 hours be placed?
The first two categories overlap.
Improved categories:
- Less than 2 hours
- 2 to less than 4 hours
- 4 to less than 6 hours
- 6 hours or more
6. Precise Questioning
Survey questions should have a clear meaning.
Imprecise question:
“Do you regularly exercise?”
The word regularly is unclear. It could mean every day, three times per week, or once per week.
Improved question:
“During the past seven days, on how many days did you exercise for at least 30 minutes?”
7. Avoiding Double-Barrelled Questions
A question should usually ask about only one issue at a time.
Poor question:
“Are you satisfied with the mathematics teacher and the mathematics textbook?”
A student might like the teacher but dislike the textbook.
It is better to ask:
“Are you satisfied with your mathematics teacher?”
and
“Are you satisfied with your mathematics textbook?”
8. Selecting Relevant Variables
A dataset may contain many variables, but not all variables are useful for answering a particular research question.
Suppose a school records:
- student age
- height
- mathematics grade
- number of hours studied
- favourite colour
- attendance
- number of siblings
- sleep duration
Suppose the research question is:
“Is mathematics achievement associated with the amount of time students spend studying mathematics?”
The most relevant variables are:
- mathematics grade
- hours spent studying mathematics
9. Explanatory and Response Variables
When studying relationships between variables, it is useful to identify the explanatory and response variables.
Explanatory variable: the variable that may help explain or predict another variable.
Response variable: the variable being measured as the outcome.
Example:
Investigate whether study time affects mathematics test score.
Explanatory variable:
![\[\text{study time}\]](https://i0.wp.com/alphyschool.org/wp-content/ql-cache/quicklatex.com-464df4abda4796b16d23a0549b5fc3bf_l3.png?resize=96%2C18&ssl=1 "Rendered by QuickLaTeX.com")
Response variable:
![\[\text{test score}\]](https://i0.wp.com/alphyschool.org/wp-content/ql-cache/quicklatex.com-17cb40b5a3615df36446e27445cdb091_l3.png?resize=83%2C13&ssl=1 "Rendered by QuickLaTeX.com")
10. Confounding Variables
Sometimes another variable affects both variables being investigated.
Suppose students who sleep more tend to obtain higher mathematics scores.
A researcher concludes:
“More sleep causes better mathematics results.”
However, students with better time-management skills may both sleep more and study more effectively.
Therefore, time-management ability could be a confounding variable.
An observed association does not necessarily prove causation.
11. Choosing Appropriate Data
When analysing data, ask:
- Is the data relevant?
- Is the data sufficiently recent?
- Is the data representative?
- Is the sample sufficiently large?
- Were the data collected reliably?
- Are important variables missing?
- Are there outliers or recording errors?
Example
Suppose researchers want to investigate the relationship between screen time and sleep duration among 16–18-year-old students.
Using data collected from 6-year-old children would not be appropriate because the population is different.
Similarly, data collected many years ago may not represent current screen-use patterns.
12. Categorizing Numerical Data for a Chi-Squared Test
A chi-squared goodness-of-fit test works with frequencies in categories.
Sometimes numerical data must therefore be divided into intervals.
Example
Suppose 100 students record the number of hours they sleep each night.
| Sleep duration | Number of students |
|---|---|
| Less than 6 hours | 14 |
| 6 to less than 7 hours | 26 |
| 7 to less than 8 hours | 37 |
| 8 hours or more | 23 |
The choice of categories should be sensible and should have a meaningful justification.
13. Why Categorisation Matters
Poorly chosen categories can:
- hide patterns
- exaggerate patterns
- produce very small expected frequencies
- make a chi-squared test inappropriate
For example, when analysing student heights from 150 cm to 190 cm, intervals that are too narrow may result in very small frequencies.
It may be better to use wider categories such as:
- 150–159 cm
- 160–169 cm
- 170–179 cm
- 180–189 cm
14. Expected Frequencies in a Chi-Squared Test
For this syllabus, categories should be chosen so that expected frequencies are greater than 5.
The chi-squared statistic is:
![\[\chi^2=\sum\frac{(O-E)^2}{E}\]](https://i0.wp.com/alphyschool.org/wp-content/ql-cache/quicklatex.com-f553d9c7c19b16e2b3458326659e21c1_l3.png?resize=163%2C45&ssl=1 "Rendered by QuickLaTeX.com")
where:
 = observed frequency
 = expected frequency
Very small expected frequencies make the chi-squared approximation less reliable.
Example
| Category | Expected frequency |
|---|---|
| A | 24 |
| B | 18 |
| C | 7 |
| D | 3 |
Category D has an expected frequency less than 5.
If categories C and D can reasonably be combined, the new expected frequency is:
![\[7+3=10\]](https://i0.wp.com/alphyschool.org/wp-content/ql-cache/quicklatex.com-8b6ccfed9416511d5fee936c1b5ee457_l3.png?resize=90%2C16&ssl=1 "Rendered by QuickLaTeX.com")
This is now greater than 5.
15. Degrees of Freedom in a Chi-Squared Goodness-of-Fit Test
If no parameters are estimated from the sample:
![\[df=k-1\]](https://i0.wp.com/alphyschool.org/wp-content/ql-cache/quicklatex.com-97e5beeceaeff91e9b6b7fa1cb491bcb_l3.png?resize=90%2C18&ssl=1 "Rendered by QuickLaTeX.com")
where  is the number of categories.
Example
If there are 5 categories:
![\[df=5-1=4\]](https://i0.wp.com/alphyschool.org/wp-content/ql-cache/quicklatex.com-74c374de73213548054edf5cf226cdbd_l3.png?resize=127%2C18&ssl=1 "Rendered by QuickLaTeX.com")
16. Estimating Parameters from the Data
Sometimes parameters of the theoretical distribution are unknown and must be estimated from the sample.
Each independently estimated parameter reduces the degrees of freedom by 1.
The general rule is:
![\[\boxed{df=k-1-p}\]](https://i0.wp.com/alphyschool.org/wp-content/ql-cache/quicklatex.com-9fbd661a74fdc9a1cebf915f7ba1ebd4_l3.png?resize=139%2C30&ssl=1 "Rendered by QuickLaTeX.com")
where:
- = number of categories
 = number of parameters estimated from the sample
Example 1 — Normal Distribution
Suppose a normal distribution is fitted to data and both  and
and  are estimated from the sample.
Then:
![\[p=2\]](https://i0.wp.com/alphyschool.org/wp-content/ql-cache/quicklatex.com-b84e31321c0ac4a253a509a2aa12f708_l3.png?resize=47%2C18&ssl=1 "Rendered by QuickLaTeX.com")
If there are 8 categories:
![\[df=8-1-2\]](https://i0.wp.com/alphyschool.org/wp-content/ql-cache/quicklatex.com-d5dd102a519b3788e609059847c91bce_l3.png?resize=124%2C18&ssl=1 "Rendered by QuickLaTeX.com")
![\[\boxed{df=5}\]](https://i0.wp.com/alphyschool.org/wp-content/ql-cache/quicklatex.com-4212d6a277a986ec9ce246a92e8b1ea2_l3.png?resize=69%2C30&ssl=1 "Rendered by QuickLaTeX.com")
Example 2 — Poisson Distribution
Suppose a Poisson distribution is fitted to data and  is estimated from the sample.
Then:
![\[p=1\]](https://i0.wp.com/alphyschool.org/wp-content/ql-cache/quicklatex.com-ddaf494d167d7b91a188bfe5b4a0dd5a_l3.png?resize=47%2C18&ssl=1 "Rendered by QuickLaTeX.com")
If there are 6 categories:
![\[df=6-1-1=4\]](https://i0.wp.com/alphyschool.org/wp-content/ql-cache/quicklatex.com-65a70dac88a507f086c8bf58e5d921c2_l3.png?resize=161%2C18&ssl=1 "Rendered by QuickLaTeX.com")
17. Reliability and Validity
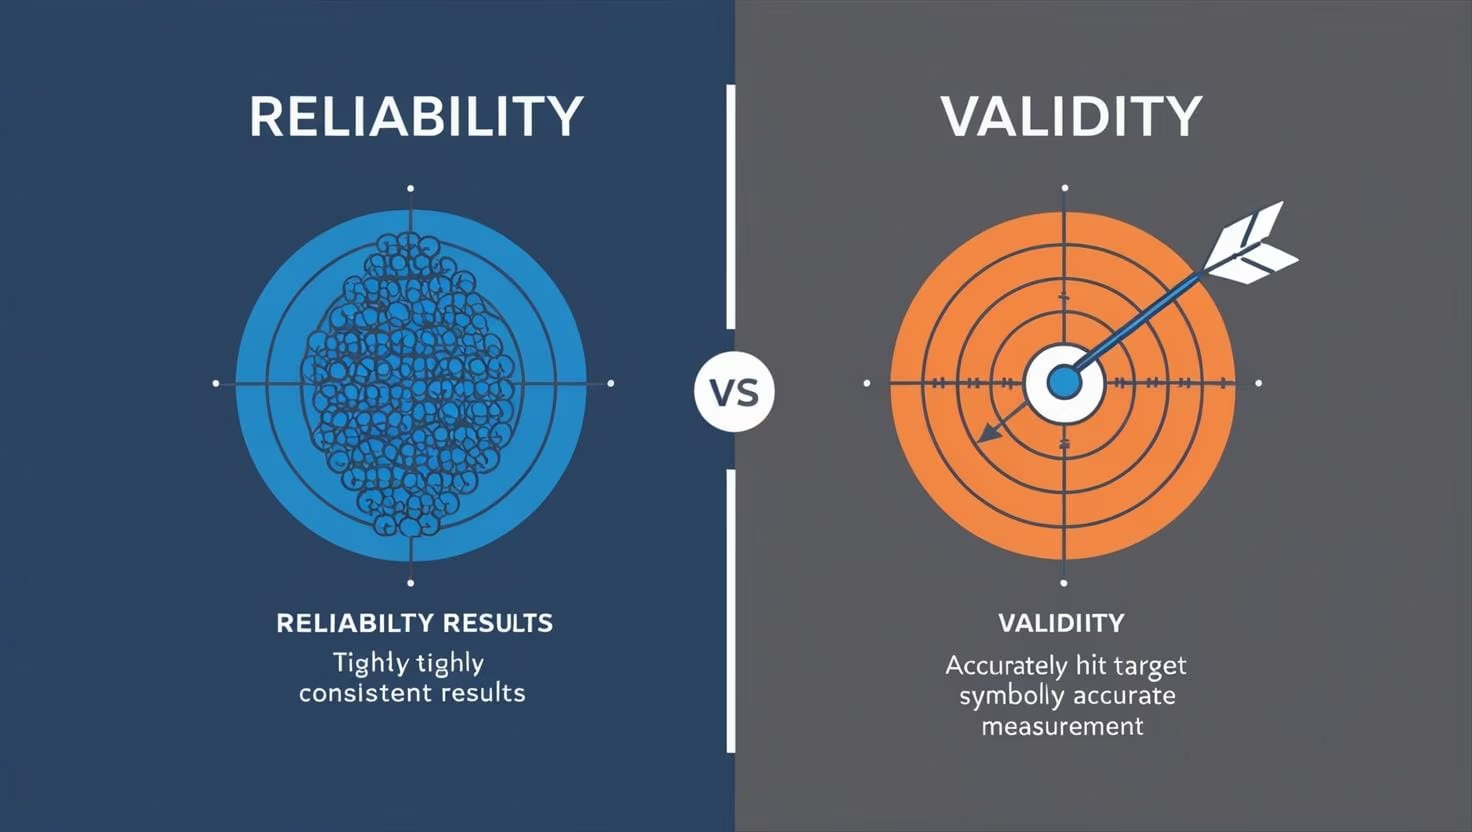
Reliability describes the consistency of a measurement.
A reliable measurement gives similar results when repeated under similar conditions.
Reliability = consistency
Validity describes whether a method actually measures what it is intended to measure.
Validity = measuring what you intend to measure
18. Reliability versus Validity
Suppose a bathroom scale always reports a person’s mass as 3 kg too high.
If the actual mass is 70 kg, repeated measurements may be:
![\[73.0,\quad72.9,\quad73.1,\quad73.0\]](https://i0.wp.com/alphyschool.org/wp-content/ql-cache/quicklatex.com-a0b4d62e5ff013d2e938e5a072663c95_l3.png?resize=228%2C18&ssl=1 "Rendered by QuickLaTeX.com")
These measurements are very consistent, so the scale is reliable.
However, the values are systematically incorrect, so the scale is not valid as an accurate measure of mass.
![\[\boxed{\text{Reliable does not necessarily mean valid}}\]](https://i0.wp.com/alphyschool.org/wp-content/ql-cache/quicklatex.com-132118531b33868d17312ec450425ee4_l3.png?resize=365%2C30&ssl=1 "Rendered by QuickLaTeX.com")
19. Another Reliability–Validity Example
Suppose a mathematics examination is intended to measure mathematical reasoning.
However, almost every question contains extremely difficult English vocabulary.
A student may perform poorly because of language difficulties rather than weak mathematical ability.
The examination may therefore have poor validity because it is partly measuring English proficiency rather than mathematics.
20. Test-Retest Reliability
In a test-retest reliability test, the same test is given to the same people on two different occasions.
The two sets of results are then compared.
If the results are strongly associated, the test is considered reliable.
Example
Twenty students complete an anxiety questionnaire.
Two weeks later, the same students complete the questionnaire again.
Suppose the correlation between the two sets of scores is:
![\[r=0.91\]](https://i0.wp.com/alphyschool.org/wp-content/ql-cache/quicklatex.com-7c465f527e2e82658a98543d12f4460c_l3.png?resize=71%2C14&ssl=1 "Rendered by QuickLaTeX.com")
This strong positive correlation provides evidence of good test-retest reliability.
21. Possible Problems with Test-Retest Reliability
Students may remember their previous answers.
Alternatively, the characteristic being measured may genuinely change between the two testing occasions.
For example, examination anxiety may change significantly before and after an important examination.
22. Parallel-Forms Reliability
In parallel-forms reliability, two different but equivalent versions of a test are given.
For example, Mathematics Test A and Mathematics Test B may contain different questions but assess:
- the same topics
- the same skills
- similar levels of difficulty
If students obtain similar results on both forms, this provides evidence of reliability.
23. Content Validity
Content validity asks:
“Does the test adequately cover the content or skills it is intended to measure?”
Suppose an IB Mathematics examination is intended to assess algebra, functions, statistics, geometry and calculus.
If 90% of the examination consists only of statistics questions, the examination may have poor content validity.
24. Criterion-Related Validity
Criterion-related validity compares a measurement with another recognised measure or outcome.
The external measure is called the criterion.
Example
A university develops a new mathematics entrance examination.
Researchers compare entrance-test scores with students’ first-year university mathematics grades.
If students with high entrance-test scores generally obtain high university mathematics grades, this provides evidence of criterion-related validity.
25. Reliability and Validity Summary
| Concept | Main Question |
|---|---|
| Reliability | Does the method produce consistent results? |
| Validity | Does the method measure what it is intended to measure? |
| Test-retest reliability | Do repeated administrations give similar results? |
| Parallel-forms reliability | Do equivalent forms give similar results? |
| Content validity | Does the test adequately represent the intended content? |
| Criterion-related validity | Does the measure agree with or predict an appropriate external criterion? |
Worked Examples
Worked Example 1 — Evaluating a Questionnaire
A school wants to investigate student satisfaction with school lunches.
The questionnaire contains:
“Don’t you agree that our nutritious and delicious school lunches are excellent?”
(a) Explain two problems with this question.
The phrase “don’t you agree” encourages the respondent to agree.
The positive words “nutritious”, “delicious” and “excellent” may also influence the respondent.
Therefore, the question is biased.
(b) Suggest an improved question.
“How satisfied are you with the school lunches?”
- Very dissatisfied
- Dissatisfied
- Neither satisfied nor dissatisfied
- Satisfied
- Very satisfied
Worked Example 2 — Choosing Variables
A dataset contains the following variables for 500 students:
- age
- height
- mathematics examination score
- mathematics study time
- hair colour
- number of absences
- daily sleep duration
- shoe size
A researcher wants to study whether study time is associated with mathematics performance.
The essential variables are:
![\[\text{mathematics study time}\]](https://i0.wp.com/alphyschool.org/wp-content/ql-cache/quicklatex.com-2ee20c5dd16fe368341dfc0447360801_l3.png?resize=213%2C18&ssl=1 "Rendered by QuickLaTeX.com")
and
![\[\text{mathematics examination score}\]](https://i0.wp.com/alphyschool.org/wp-content/ql-cache/quicklatex.com-fc1dc73767e743a21a2057ebe0e0ad5b_l3.png?resize=276%2C15&ssl=1 "Rendered by QuickLaTeX.com")
Study time is the explanatory variable.
Mathematics examination score is the response variable.
Worked Example 3 — Degrees of Freedom
A researcher wishes to determine whether examination marks follow a normal distribution.
The results are grouped into 7 categories. The mean and standard deviation are estimated from the sample.
Find the degrees of freedom.
Solution:
![\[k=7\]](https://i0.wp.com/alphyschool.org/wp-content/ql-cache/quicklatex.com-8f11ee2fdc3a123cb6e28b193298060a_l3.png?resize=46%2C14&ssl=1 "Rendered by QuickLaTeX.com")
Two parameters are estimated:
![\[\mu \quad \text{and} \quad \sigma\]](https://i0.wp.com/alphyschool.org/wp-content/ql-cache/quicklatex.com-c641fae3a2cba09870e1d7ebc5a343ab_l3.png?resize=96%2C18&ssl=1 "Rendered by QuickLaTeX.com")
Hence:
Therefore:
![\[df=k-1-p\]](https://i0.wp.com/alphyschool.org/wp-content/ql-cache/quicklatex.com-aa4e75cec6b0944903d29afd8f88f657_l3.png?resize=125%2C18&ssl=1 "Rendered by QuickLaTeX.com")
![\[df=7-1-2\]](https://i0.wp.com/alphyschool.org/wp-content/ql-cache/quicklatex.com-c48c852d3e0023b005b59bb4838d6033_l3.png?resize=124%2C18&ssl=1 "Rendered by QuickLaTeX.com")
![\[\boxed{df=4}\]](https://i0.wp.com/alphyschool.org/wp-content/ql-cache/quicklatex.com-3f40008074fba6e8f6367fd04531a8b4_l3.png?resize=69%2C30&ssl=1 "Rendered by QuickLaTeX.com")
Worked Example 4 — Combining Categories
| Category | Expected Frequency |
|---|---|
| A | 18.6 |
| B | 15.2 |
| C | 9.1 |
| D | 4.3 |
| E | 2.8 |
Categories D and E have expected frequencies less than 5.
If they can be meaningfully combined:
![\[4.3+2.8=7.1\]](https://i0.wp.com/alphyschool.org/wp-content/ql-cache/quicklatex.com-951ee9c9fd6e3cd098d1c88688b3d863_l3.png?resize=127%2C16&ssl=1 "Rendered by QuickLaTeX.com")
The combined expected frequency is greater than 5.
Worked Example 5 — Reliability or Validity?
A questionnaire is designed to measure mathematical confidence.
Students complete the questionnaire twice, three weeks apart.
The correlation between the two scores is:
![\[r=0.94\]](https://i0.wp.com/alphyschool.org/wp-content/ql-cache/quicklatex.com-bc91d200e0809023be3ee36c433a9cee_l3.png?resize=72%2C14&ssl=1 "Rendered by QuickLaTeX.com")
This provides strong evidence of test-retest reliability.
However, it does not prove validity. The questionnaire might consistently measure something other than mathematical confidence.
IB-Style Practice Questions
Question 1 — Survey Design
A school wishes to investigate whether students believe that homework improves academic performance.
The following question is proposed:
“Since homework clearly helps students achieve better grades, how useful do you think homework is?”
(a) Explain why this question may produce biased results.
(b) Write a more appropriate question.
(c) Suggest a set of structured response options.
Show Answer
(a) The statement assumes that homework is beneficial before the respondent answers. This may encourage a positive response.
(b) A suitable question is:
“How useful do you think homework is for improving academic performance?”
(c)
- Not useful at all
- Slightly useful
- Moderately useful
- Very useful
- Extremely useful
Question 2 — Structured versus Unstructured
A researcher wishes to investigate students’ opinions about online learning.
Question A: Rate your experience of online learning from 1 to 5.
Question B: Describe your experience of online learning.
(a) State which question is structured.
(b) Give one advantage of Question A.
(c) Give one advantage of Question B.
Show Answer
(a) Question A.
(b) The answers can easily be converted into numerical data and analysed statistically.
(c) Question B allows students to give detailed explanations and may reveal unexpected information.
Question 3 — Precise Questioning
A questionnaire contains:
“Do you exercise regularly?”
Explain one weakness of this question and propose an improved version.
Show Answer
The word regularly is ambiguous because respondents may interpret it differently.
An improved version is:
“During the last seven days, on how many days did you exercise for at least 30 minutes?”
Question 4 — Selecting Relevant Variables
A researcher wishes to study whether the number of hours students sleep affects their performance on a mathematics examination.
The following variables are available:
- sleep duration
- examination result
- age
- favourite sport
- height
- number of mathematics lessons attended
(a) State the explanatory variable.
(b) State the response variable.
(c) Identify one other potentially relevant variable and explain why it could matter.
Show Answer
(a) Sleep duration.
(b) Examination result.
(c) The number of mathematics lessons attended may affect examination performance and may therefore act as a confounding variable.
Question 5 — Categorisation
A researcher records the daily screen time of 80 students.
Expected frequencies from a theoretical model are:
![\[2.1,\quad4.4,\quad9.8,\quad17.2,\quad20.1,\quad15.6,\quad10.8\]](https://i0.wp.com/alphyschool.org/wp-content/ql-cache/quicklatex.com-af5f8da17fcad9a25a39d4dac39b223b_l3.png?resize=393%2C18&ssl=1 "Rendered by QuickLaTeX.com")
Explain one change that should be made before carrying out a chi-squared goodness-of-fit test.
Show Answer
The first two expected frequencies are less than 5.
The first two categories may be combined:
![\[2.1+4.4=6.5\]](https://i0.wp.com/alphyschool.org/wp-content/ql-cache/quicklatex.com-e54d9b8db7a5c38dfc235cab09e50677_l3.png?resize=127%2C16&ssl=1 "Rendered by QuickLaTeX.com")
The new expected frequency is greater than 5.
Question 6 — Degrees of Freedom
A sample is fitted to a Poisson distribution.
The data are divided into 8 categories and the Poisson parameter is estimated from the sample.
Find the degrees of freedom.
Show Answer
![\[df=8-1-1\]](https://i0.wp.com/alphyschool.org/wp-content/ql-cache/quicklatex.com-e886f6a86965c4a28c2b4e7dc7d49f79_l3.png?resize=124%2C18&ssl=1 "Rendered by QuickLaTeX.com")
![\[\boxed{df=6}\]](https://i0.wp.com/alphyschool.org/wp-content/ql-cache/quicklatex.com-e80934acb06b9b4964b5261b3471fde9_l3.png?resize=69%2C30&ssl=1 "Rendered by QuickLaTeX.com")
Question 7 — Normal Distribution
A researcher tests whether data follow a normal distribution.
After combining categories where necessary, there are 9 categories.
The population mean and standard deviation are unknown and are estimated using the sample.
Find the appropriate degrees of freedom.
Show Answer
Two parameters are estimated:
Therefore:
![\[df=9-1-2\]](https://i0.wp.com/alphyschool.org/wp-content/ql-cache/quicklatex.com-0b7d42dccceadb84c02d17837067edb5_l3.png?resize=124%2C18&ssl=1 "Rendered by QuickLaTeX.com")
Question 8 — Reliability and Validity
A digital thermometer gives the following readings when placed in water whose temperature is known to be  :
:
![\[52.7,\quad52.8,\quad52.7,\quad52.8,\quad52.7\]](https://i0.wp.com/alphyschool.org/wp-content/ql-cache/quicklatex.com-7c0a936bfe823e0246f484d0b27e9f98_l3.png?resize=294%2C18&ssl=1 "Rendered by QuickLaTeX.com")
Discuss the reliability and validity of the thermometer.
Show Answer
The readings are very close to one another, so the thermometer has high reliability.
However, the true temperature is , while the thermometer consistently gives readings near  .
.
Therefore, the thermometer does not have good validity as a measure of the true temperature.
Question 9 — Test-Retest Reliability
Thirty students complete a questionnaire designed to measure examination anxiety.
They complete the questionnaire again two weeks later.
The correlation between their first and second scores is:
![\[r=0.89\]](https://i0.wp.com/alphyschool.org/wp-content/ql-cache/quicklatex.com-b962725fe178fa5a4ae6ba335e38bfc0_l3.png?resize=72%2C14&ssl=1 "Rendered by QuickLaTeX.com")
What does this suggest?
Show Answer
The strong positive correlation indicates that students obtained similar scores on both occasions.
This provides evidence of good test-retest reliability.
It does not by itself demonstrate validity.
Question 10 — Parallel Forms
A school creates two mathematics examinations, Form A and Form B.
Both tests assess the same topics and are designed to have similar difficulty.
A strong positive correlation is found between the two sets of scores.
Explain what this suggests.
Show Answer
This provides evidence of parallel-forms reliability.
Students who perform well on one version generally perform well on the equivalent version.
Question 11 — Content Validity
An examination is intended to assess an entire statistics course.
However, 85% of the questions concern correlation and regression.
Explain why the examination may have poor content validity.
Show Answer
The examination does not adequately represent all the topics covered by the course.
Since most of the examination concentrates on only one area, it may not accurately measure students’ overall understanding.
Question 12 — Criterion-Related Validity
A new university mathematics entrance test is developed.
Researchers compare candidates’ entrance-test results with their mathematics grades after their first year at university.
A strong positive correlation is found.
Explain what this result suggests.
Show Answer
The university mathematics grade acts as an external criterion.
The strong association provides evidence of criterion-related validity.
Challenge Question
A psychologist develops a questionnaire designed to measure students’ mathematical confidence.
The questionnaire is given to 200 students.
Two weeks later, the same students complete it again. The correlation between the two scores is:
![\[r=0.93\]](https://i0.wp.com/alphyschool.org/wp-content/ql-cache/quicklatex.com-f8e534e932dee6847581df1649314aa3_l3.png?resize=72%2C14&ssl=1 "Rendered by QuickLaTeX.com")
The researcher also compares questionnaire scores with students’ mathematics examination results and obtains:
![\[r=0.68\]](https://i0.wp.com/alphyschool.org/wp-content/ql-cache/quicklatex.com-677c9856692c7b5d06456c0b0391ea60_l3.png?resize=72%2C14&ssl=1 "Rendered by QuickLaTeX.com")
(a) What aspect of the questionnaire is supported by  ?
?
(b) What aspect is investigated using  ?
?
(c) Explain why a reliable questionnaire is not necessarily valid.
Show Answer
(a)
The correlation compares the same test given on two occasions.
Therefore, it investigates:
![\[\boxed{\text{test-retest reliability}}\]](https://i0.wp.com/alphyschool.org/wp-content/ql-cache/quicklatex.com-03d0050798c419ad8f8cd4f103656938_l3.png?resize=191%2C30&ssl=1 "Rendered by QuickLaTeX.com")
Since , there is strong evidence that the questionnaire produces consistent scores.
(b)
The mathematics examination score acts as an external criterion.
Therefore, this investigates:
![\[\boxed{\text{criterion-related validity}}\]](https://i0.wp.com/alphyschool.org/wp-content/ql-cache/quicklatex.com-405febb6a00e7807442d5abd2af39132_l3.png?resize=225%2C30&ssl=1 "Rendered by QuickLaTeX.com")
(c)
A measurement can consistently produce similar results while still measuring the wrong characteristic.
Therefore:
![\[\boxed{\text{Reliability concerns consistency, whereas validity concerns whether the intended quantity is actually measured.}}\]](https://i0.wp.com/alphyschool.org/wp-content/ql-cache/quicklatex.com-aa6c6b865e96aa8b4797ae3bd1b8c22b_l3.png?resize=640%2C19&ssl=1 "Rendered by QuickLaTeX.com")
Common Mistakes
1. Saying that reliable means correct
Reliability means consistent, not necessarily correct.
2. Saying that correlation automatically proves validity
A correlation may provide evidence for criterion-related validity, but the context must still be considered.
3. Forgetting estimated parameters when finding degrees of freedom
Do not automatically use:
If parameters are estimated from the sample, use:
4. Using categories with very small expected frequencies
For this syllabus, students should recognise that appropriate categories should have:
![\[\boxed{E>5}\]](https://i0.wp.com/alphyschool.org/wp-content/ql-cache/quicklatex.com-ef5014bc2eb015acd670f5161e2f9712_l3.png?resize=66%2C27&ssl=1 "Rendered by QuickLaTeX.com")
5. Combining categories without considering meaning
Categories should only be combined when doing so is sensible in the context.
6. Confusing structured and unstructured questions
A structured question supplies predetermined answers, while an unstructured question allows free responses.
Exam Checklist
- Is the question biased or leading?
- Is the question precise?
- Does it ask only one thing?
- Are the answer choices mutually exclusive?
- Do the choices cover all reasonable answers?
- Are sensitive questions necessary?
- Are the variables relevant to the research question?
- Could confounding variables affect the conclusion?
- For
 , are expected frequencies greater than 5?
 - Have estimated parameters been considered when finding degrees of freedom?
- Is the issue one of reliability or validity?
- Which type of reliability or validity is being tested?
Remember:
![\[\boxed{\text{Reliability = consistency}}\]](https://i0.wp.com/alphyschool.org/wp-content/ql-cache/quicklatex.com-efa2aa6b86d0e1be751ad80af06fd79e_l3.png?resize=231%2C30&ssl=1 "Rendered by QuickLaTeX.com")
![\[\boxed{\text{Validity = measuring what you intend to measure}}\]](https://i0.wp.com/alphyschool.org/wp-content/ql-cache/quicklatex.com-2c529efd37d2daacd3539e4ed8af4713_l3.png?resize=452%2C30&ssl=1 "Rendered by QuickLaTeX.com")
and for a chi-squared goodness-of-fit test:
where is the number of parameters estimated from the sample.